The toolbar is used in Monitoring UI for advanced options for trend metrics. This article covers what the individual items on the toolbar do.

The tools will be covered in order from left to right.
Download plot as a png
“Download plot as a png” downloads a picture as a .png file about the current metrics that are seen in the trend window.

Zoom tools
The zoom tools allow you to zoom in and out on your trend metrics.
Icons explained starting from the left:
- Zoom: default tool. Use the mouse to drag the area you want to see closer.
- Pan: Pan the trend metrics to get to your preferred time view.
- Zoom in & Zoom out: Zooms the metrics in or out
- Autoscale: Scales the trends automatically
- Reset axes: Returns the view to its original state
Toggle Spike Lines
Spike Lines lets you use to view the date and values of the metrics more clearly.
Data on hover tools
You can either select to view one metric at a time with the “Show closest data on hover” tool, or view multiple metrics at the same time using the “Compare data on hover” tool.
Export as CSV
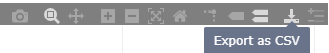
Exporting to CSV file is covered in the article Creating CSV file.
Toggle min/max/avg
By clicking the “toggle min/max/avg” you can bring up the minimum, maximum and average values of the metrics. As a default, Condence shows the average values.
Pop the graph out to full screen
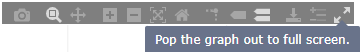
Opens the metrics to a full window for closer inspection. On the full screen, you have options to put metrics into followed issues, and also to view the Forecast tool.