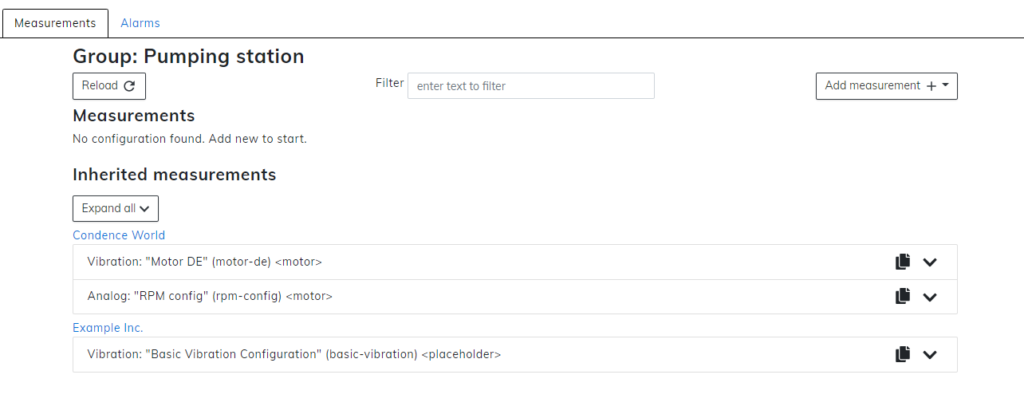
This article follows steps on how to add usage hours measurement to your terminal setup via Device Manager. If you require help locating your preferred group of devices, please refer to the article Locating your device.
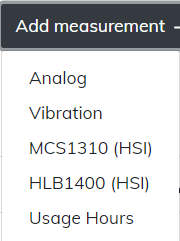
From the dropdown menu select usage hours.
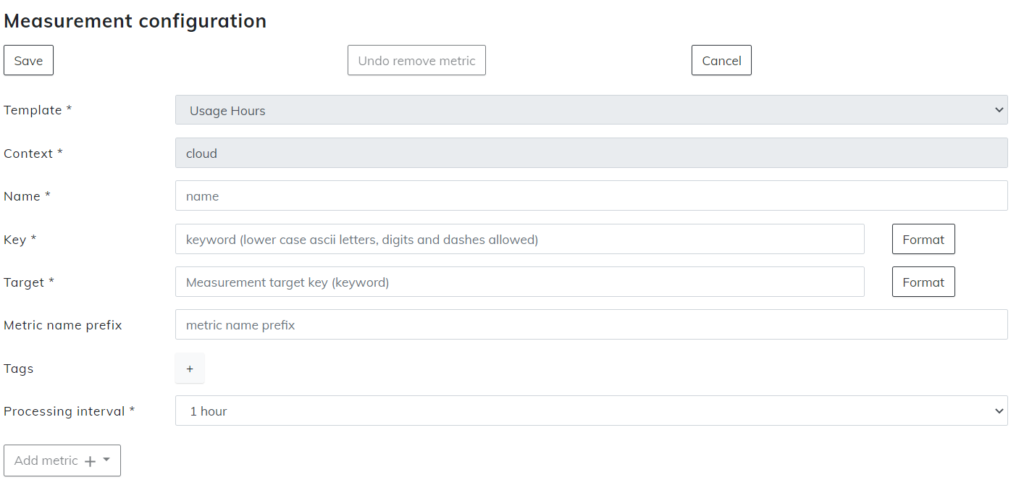
Measurement configuration
Sections with asterisk * are mandatory.
Template and Context can not be changed and such are greyed out. At Template it should say Usage hours and at Context, it should be Cloud.
Name is what the measurement will be known from here on out. It is recommended to use the name that matches the measurement so it will be easy to recognize.
Key is the unique identification for the measurement. On this level of the hierarchy, the key needs to be unique and can’t overlap with any other. As with the name, it is highly recommended to use the key that matches the intended measurement. Key requires only the use of lower case ASCII letters, digits, and dashes instead of spaces.
Target needs to match the target that is used in the measurement you wish to apply Time to Service into. For example, if you want to use the Time to Service for 10-1000Hz metrics that have a target motor, you need to insert a motor into this Target also.
Processing interval has one option in the dropdown menu that is 1 hour. Usage hour is updated once per hour so this is not changeable.
Usage hours differ from other measurements in a way that you can not use Add metric function in this measurement. Instead, you may use the options that are preconfigured below.
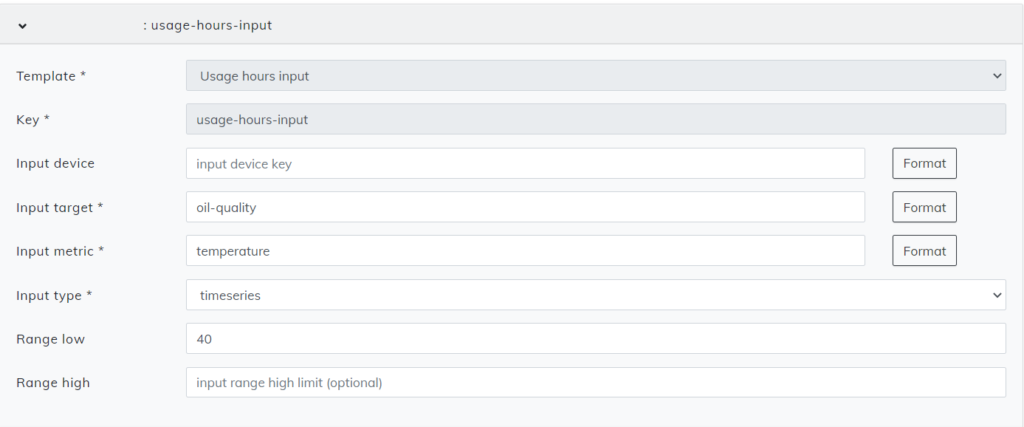
Usage hours input lets you configure the target and metrics to measure with your measurement.
Template and Key are non-changeable.
Input target needs to be identical to the metrics target that you wish to apply Time to Service into.
Input metric lets you select what exactly you want to measure.
Input type has one option that is timeseries.
Range low is not mandatory. It is used to select the lowest point where the usage hours meter will go.
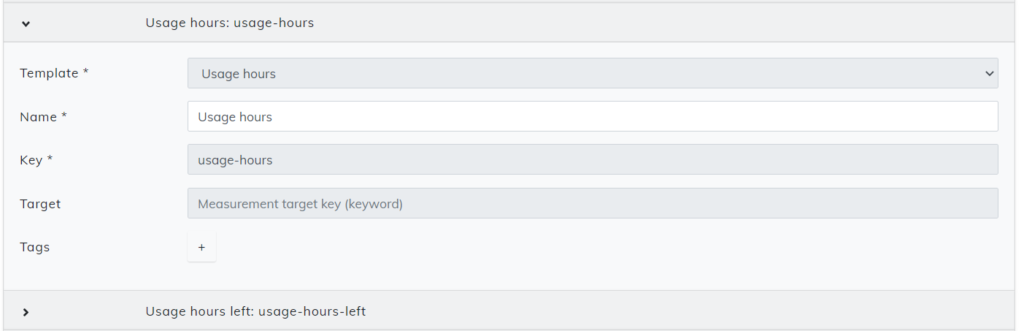
Usage hours and Usage hours left to use the exact same metrics.
Name is changeable but it is recommended to use the one in template.
Template and Key are non-changeable.
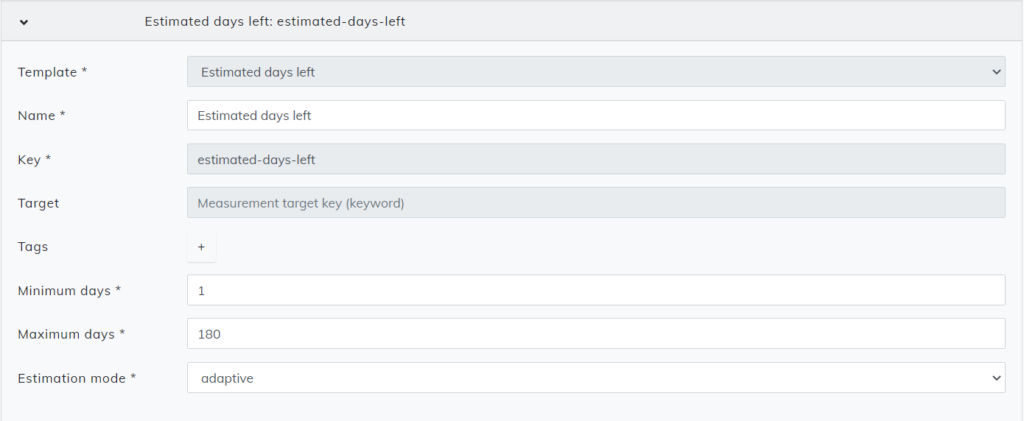
Estimated days left differ from previous entries on this list.
Same as before, Template and Key are non-changeable. The name can be changed.
Minimum days is the lowest amount of days that the usage hours window will show
Maximum days is the expected maximum amount of days for the usage hours window to show. This is, simplified, the time your device is expected to last.
Estimation mode has two options, adaptive and fixed. This is used to select how the days are estimated. Adaptive measurement or fixed metrics.
Setup
After measurements are done, head to the Setup section. This can be selected from the upper row.
When you are in the setup section, select Add setup and Cloud measurement setup.
In the Key section, write the name that you want to use for this setup.
Measurements have a list of available measurements. Select the name that was used for your Usage hours metrics.
Press Save and continue.
For a more in-depth look at how to add Setups, you may look at the article Setups.

Publish the setup
Head to the Device status tab. This is selectable from the upper menu row.
Below the terminals tab, you can see the Select cloud setup dropdown menu. The key that was used in the setup will be shown here. Select your preferred setup and click on it.
Press publish, and your usage hours setup will be published to your terminal.
For a more in-depth look at how to publish Setups, you may look at the article Publishing the Setup.
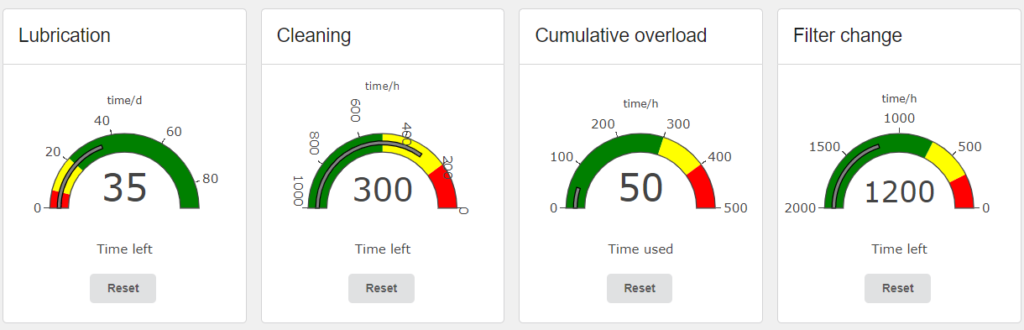
Example